What Counts as a Mid-Market Food Manufacturer? Revenue, Headcount and Planning Needs
What Counts as a Mid-Market Food Manufacturer? Revenue, Headcount and Planning Needs
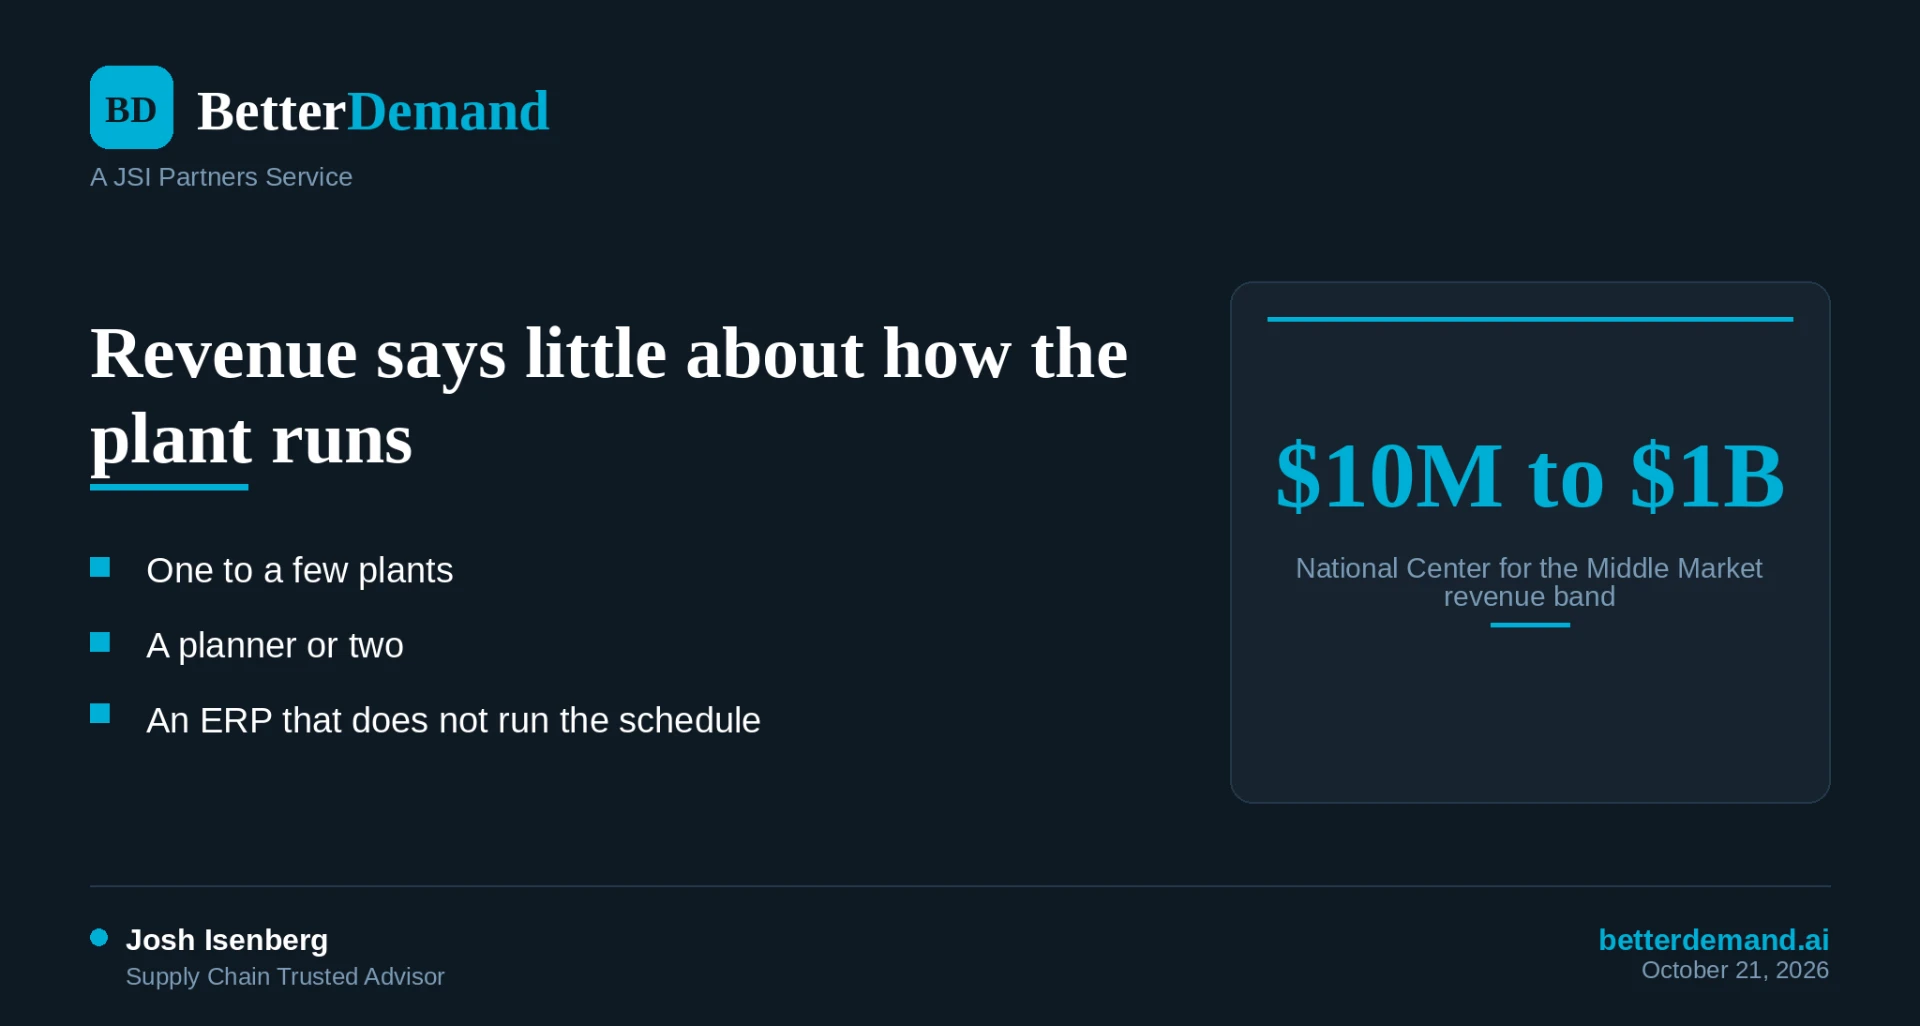
TL;DR: A mid-market food manufacturer is usually defined by revenue (the National Center for the Middle Market uses $10 million to $1 billion), but revenue says little about how the plant runs. The better test is operational: one to a few plants, one or two planners, an ERP that runs finance and inventory but not the schedule, and retail customers like Walmart, Costco and Kroger that measure you on every case. The self-check at the end shows which planning stage you are in.
Search for how big a mid-sized food plant is and you get a revenue band, a headcount cap, or both. They come from different agencies for different reasons, and none of them was written to describe planning. This post lays out the public definitions, checks what each one actually says, and then describes what a plant of this size deals with every week.
For the broader CPG definition and company examples, see our mid-market CPG companies guide. This post stays on food manufacturers.
What the public definitions say
Revenue: the National Center for the Middle Market. The center, based at the Ohio State University Fisher College of Business, describes its definition as "an annual revenue-based definition of $10 million to $1 billion" (NCMM, 2021). The same piece says middle market businesses represent a third of private sector GDP and employment. That is a wide band. A $15 million regional sauce maker and a $900 million multi-plant bakery sit in the same bucket.
Headcount: SBA size standards for NAICS 311. The U.S. Small Business Administration sets "small business" limits by industry code, in employees, under 13 CFR 121.201. For food manufacturing (NAICS 311) the limits run from 500 to 1,400 employees depending on the product. Examples from the current table: 700 for all other miscellaneous food manufacturing (311999) and for perishable prepared food manufacturing (311991), 1,000 for commercial bakeries (311812), and 1,250 for frozen specialty food (311412) and cheese (311513).
Read that carefully. A cheese plant with 1,200 people is "small" to the SBA. These standards decide who qualifies for set-asides and loans. They are a ceiling for small-business status, not a description of a mid-sized operation, and the 20 to 300 person plants described below sit far under every one of them.
Establishment counts: Census County Business Patterns. The USDA Economic Research Service, citing Census County Business Patterns, reports 42,708 food and beverage manufacturing establishments in the United States in 2022. The same page, citing the Annual Survey of Manufactures, puts sector employment at 1.7 million in 2021, or 15.4 percent of all U.S. manufacturing employment. We could not retrieve the establishment-by-employment-size tables for this post, so we make no claim here about how many of those plants fall in any size class. What the totals do show is how many separate plants are running their own schedules.
Why revenue and headcount miss the point
Two plants with $60 million in sales can have nothing in common. One runs a single high-speed line on three SKUs. The other runs two plants, 400 SKUs, allergen sequencing and a cold chain. The revenue bucket is the same. The planning problem is not.
At BetterDemand we work with a narrower profile than the NCMM band: roughly 20 to 300 people, one to a few plants. That is an operating definition, not a public standard. It tracks the point where the owner or plant manager can no longer hold the schedule in their head, and where the company cannot yet justify a planning department.
What planning looks like at this size
Across our JSI Partners consulting work with food and confectionery producers, the same pattern shows up.
One to a few plants. Each plant has its own lines, its own changeover rules and its own crew. When a line goes down, the replan happens in the plant manager's office, often the same morning.
A planner or two. One person builds the weekly schedule. A second may handle purchasing or customer service and covers for the first. When the scheduler is out, the schedule is out.
An ERP that runs finance and inventory, not the schedule. The ERP (Business Central, NetSuite, Aptean, Plex or SAP Business One are common) holds orders, bills of material, lots and receipts. It does not tell you which line is over 100 percent next week or what a rush order does to Thursday. That work moves to a spreadsheet. Our post on why ERP projects run 17 months against a 12-month plan covers why that gap often stays open longer than expected.
Customers that grade you on every case. Large retailers grade suppliers on delivery performance, and being a smaller supplier does not excuse a late or short case. Walmart's on-time, in-full program is the clearest example, and we break down how it is scored and what suppliers control.
The planning stages we see
Most plants of this size sit in one of three stages.
Stage one: the schedule lives in one head. A whiteboard or a spreadsheet, maintained by one person. Customer orders arrive, the scheduler sequences runs by feel, and the owner hears about problems when a truck is late.
Stage two: a spreadsheet schedule with rules. The plant has written down its changeover matrix, run rates and a frozen window. Orders get resequenced inside that window by rule, not by argument. Overloads still surface a day or two late because the spreadsheet does not check capacity by line.
Stage three: capacity is visible a week or more ahead. Someone can say, on Monday, which line is over 100 percent next week and which lever (overtime, an added shift, a changed sequence) fixes it. Only here does demand planning pay off, because the plan can actually be executed.
We put capacity first for a reason. You cannot forecast what you cannot execute. A better number for next quarter does not help if a run slips this Thursday and nobody sees the knock-on until the shift ends. Once capacity is stable, the Forecaster is the next step: a statistical forecast by item, demand at the retailer distribution center level, and a comparison against what the customer's own forecast says.
Self-check: which stage are you in?
Answer yes or no. Count the yeses.
- Can you name, today, which line is over 100 percent next week?
- Does your schedule have a written frozen window that sales and the plant both follow?
- Is your changeover matrix written down somewhere other than the scheduler's memory?
- If your scheduler is out for a week, can someone else build the schedule from the same file?
- Do you compare your forecast by item to what Walmart, Costco or Kroger sent you, and track the gap?
Zero or one yes: stage one. Two or three: stage two. Four or five: stage three, and you are ready to work on forecast quality.
What to do this week
- Write down your changeover matrix for your busiest line, even as a rough grid of product-to-product times. Ask the scheduler to review it, since this is the knowledge that lives only in their head.
- Pick one week from the last quarter when a run slipped. List what got resequenced and who found out when. That timeline shows where your frozen window should be.
- Export next week's open orders from the ERP and total the scheduled hours per line against available hours. A simple sheet is enough to find your first line over 100 percent.
BetterDemand runs beside the ERP, on the exports it already produces. Capacity shows which line is over 100 percent next week and lets you test overtime, an added shift or a changed sequence before you commit. Forecaster adds the statistical forecast by item and retailer distribution center, and Agent answers plain-English questions from the schedule math, with the source on every answer. It never replaces the ERP. Plans are priced by sites and SKUs, not revenue, and you can see the current numbers on the pricing page.
betterdemand.ai
Two free playbooks: Cost of Forecast Error and the S&OP Playbook