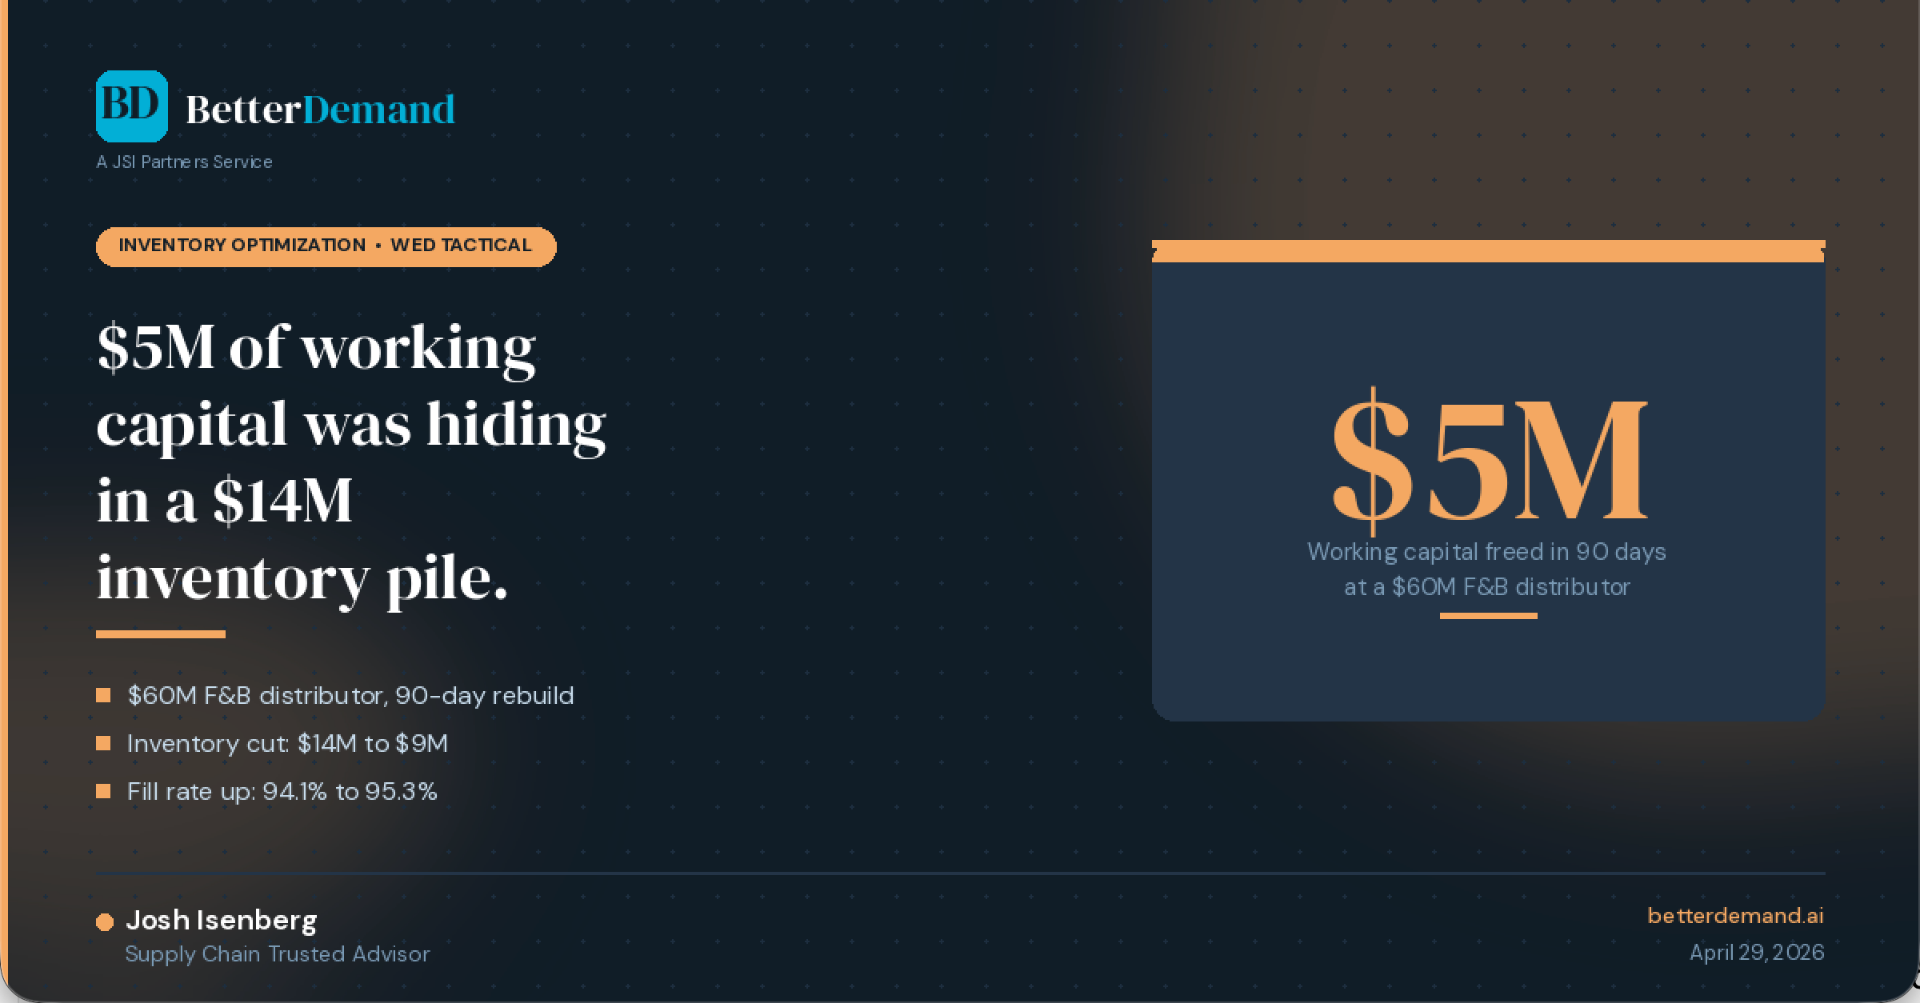
Where $5M Was Hiding in a $14M Inventory Pile
A mid-market F&B distributor freed $5M of working capital in 90 days while improving fill rate from 94.1% to 95.3%. Most of the cash wasn't hiding in obvious places — it was hiding in policies that treated every SKU the same.
A $60M food distributor was sitting on $14M of inventory. Their CFO wanted to free up cash. Their VP Ops wanted to protect fill rate. Both thought they couldn't have both. Ninety days later, inventory was down to $9M, fill rate was up to 95.3%, and the company hadn't stocked out on a single A-item.
The point of this post isn't to celebrate the result. It's to explain why the result was sitting there in the first place — and why it's almost certainly sitting in your warehouse too.
The diagnostic that kicked everything off
We started with the simplest analysis you can run on an inventory file: an ABC-XYZ split. ABC by velocity, XYZ by demand variability. Two days of work, mostly in spreadsheets.
What came out of it: 38% of SKUs had moved exactly zero units in the last 90 days, but were stocked at the same safety levels as the company's A-movers. The min/max policy was uniform across the entire catalog.
That's the tell. When one inventory policy applies to thousands of SKUs that behave nothing alike, the policy is wrong for almost all of them. Either you're overstocking the slow tail, understocking the fast head, or both.
The 90-day rebuild
Three things, in order:
Recut the catalog. Not every SKU deserves to be stocked. We retired 11% of SKUs entirely (zero movement plus no strategic reason to keep them) and moved another 22% to special-order or make-to-order status. Cash freed before any safety stock work even started.
Rebuild safety stock by demand variability, not by gut. Slow movers got cut hard — most didn't justify any buffer. Fast movers actually got slightly more buffer in some cases, not less, because the analysis showed under-stocking on a handful of high-velocity items.
Tighten MOQs. Three suppliers were happy to negotiate smaller minimum order quantities once we showed them the volume math and committed to a tighter forecast cadence. That alone took $1.2M out of the inventory pile.
What this means for mid-market operators
The reason this kind of result is repeatable is depressing: most mid-market companies are running one inventory policy across SKUs that have nothing in common except the warehouse they sit in. A C-item stocked like an A-item is cash the business doesn't have to invest. An A-item stocked like a B-item is service risk the business is silently absorbing.
You don't need new software to find this. You need a clean SKU master, 12 months of demand history, and someone willing to tell the COO that uniform safety stock policies are the cause of half the working capital problem.
Ready to Forecast Smarter?
BetterDemand combines AI-powered forecasting with real supply chain expertise. Visit betterdemand.ai to learn how we help distributors and manufacturers plan with confidence.