How to Size Lead Time Buffer Without Trapping Cash
Most importers buffer lead time with a gut number. "Call it three weeks of safety." That estimate costs more working capital than it prevents stockouts, because it is usually sized to the worst week anyone remembers instead of to the shape of the actual distribution.
After a decade inside demand planning at $30M–$250M companies, I have yet to meet an ops team that did not have at least a dozen SKUs carrying twice the buffer they needed. The cash trapped there is cash you cannot redeploy into inventory that actually moves, into new product launches, or onto the balance sheet.
Here is the math that actually works.
For each overseas SKU, pull the last 12 POs. Record the promised lead time and the actual receipt date. Compute the delta for each PO. Then compute the standard deviation of those deltas — not the average.
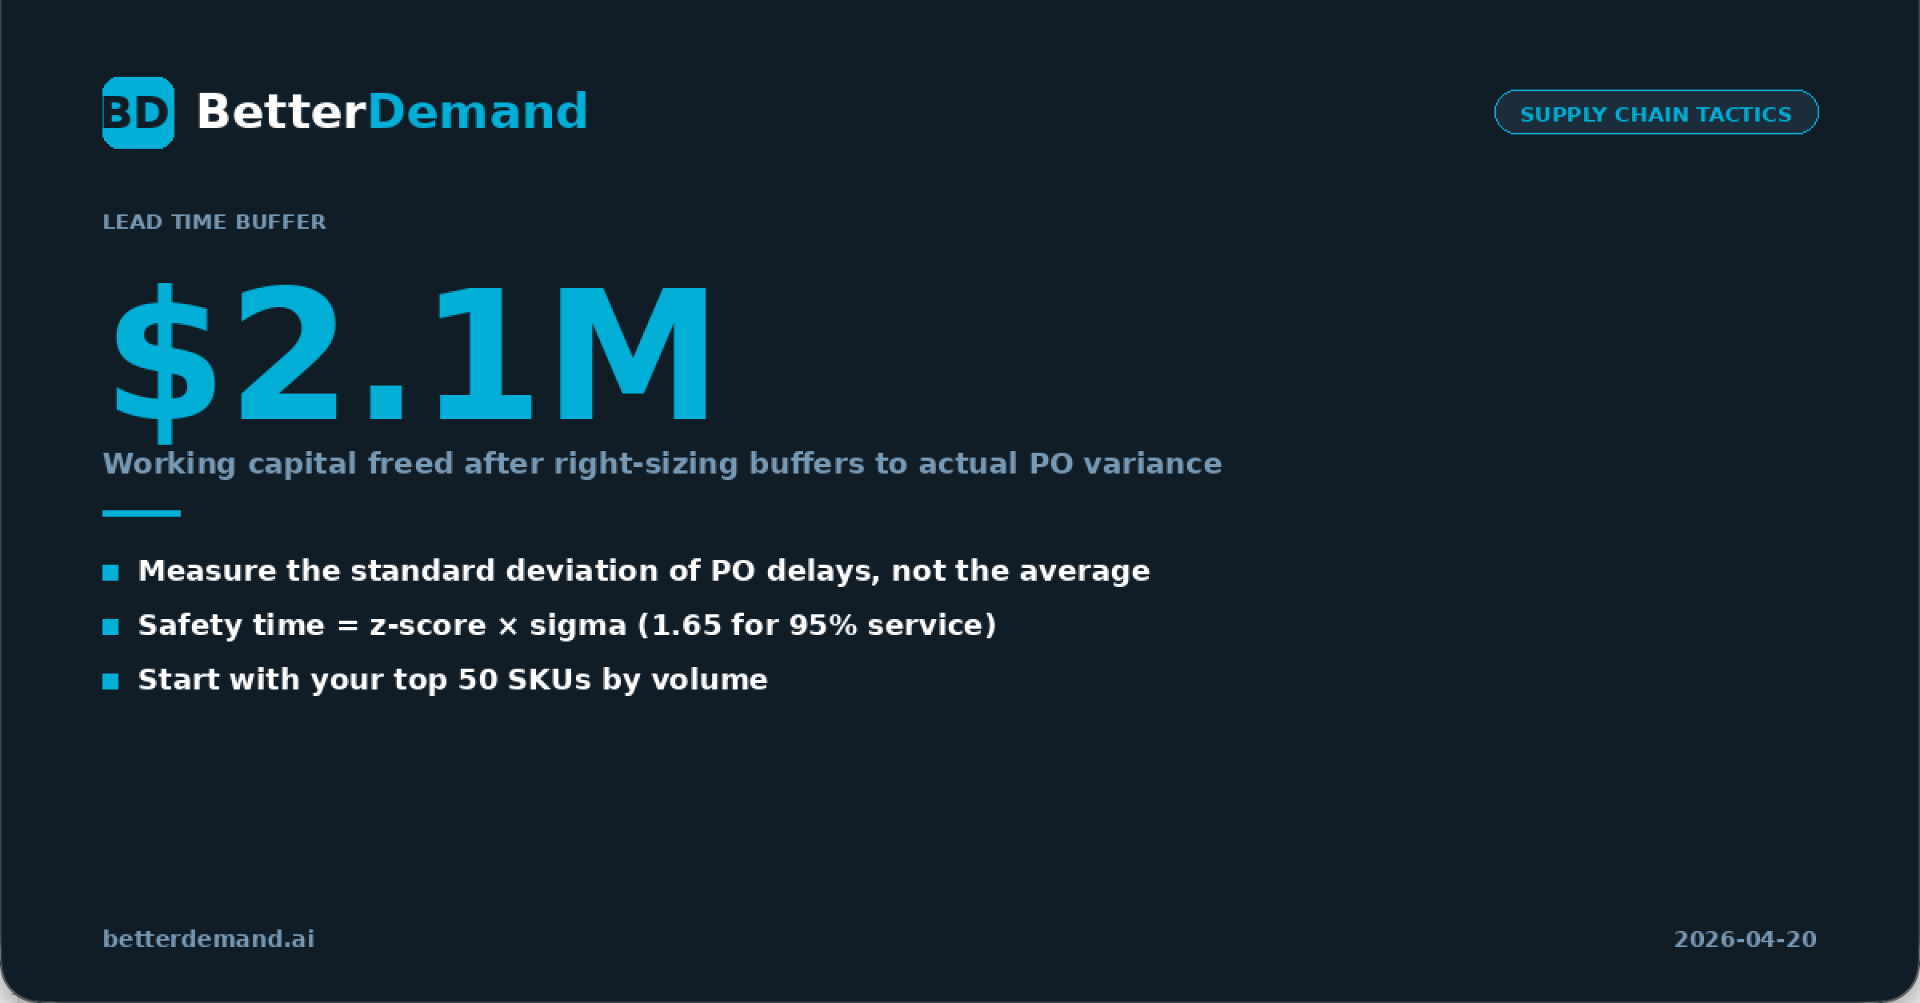
Your safety time is a z-score times that standard deviation. For a 95% service target, z is 1.65. For 98%, z is 2.05. Pick the service level by SKU class. A-items deserve 98% or higher. C-items often run fine at 90%.
The trap most teams fall into is sizing buffer to the average delay. Averages hide the tail. One housewares importer we worked with had a SKU showing a 6-day mean delay — totally manageable on paper. The standard deviation was 14 days. That was the SKU that stocked out every other quarter, because the buffer was sized to the mean and the tail did the damage.
The same importer ran this exercise across their top 200 SKUs last quarter. The average buffer dropped from 21 days to 12. Total working capital freed: $2.1M. And stockouts actually improved by 40 basis points, because the buffer was now sized to the variance of each lane instead of to a blanket three-week cushion.
You do not need a new ERP. You do not need a new planning system. A CSV export of your last 12 POs per SKU, pivoted in Excel or a BI tool, is the entire toolkit for the first pass.
A few practical notes. First, clean the data: exclude any PO that was expedited or cancelled, since those skew the distribution. Second, group SKUs by lane and origin — a factory in Shenzhen behaves differently from a factory in Ho Chi Minh, and you want to catch that. Third, refresh the calculation quarterly. Lead time variance drifts as carriers, ports, and factories change, and last year's number rarely holds up.
Start with your top 50 SKUs by volume. That is where working capital concentrates and that is where the math pays off fastest.
Cash trapped in safety stock is cash you cannot redeploy. Run the pull this week.
Ready to Forecast Smarter?
BetterDemand combines AI-powered forecasting with real supply chain expertise. Visit betterdemand.ai to learn how we help distributors and manufacturers plan with confidence.