Why Your Forecast Bias Report Is Lying to You
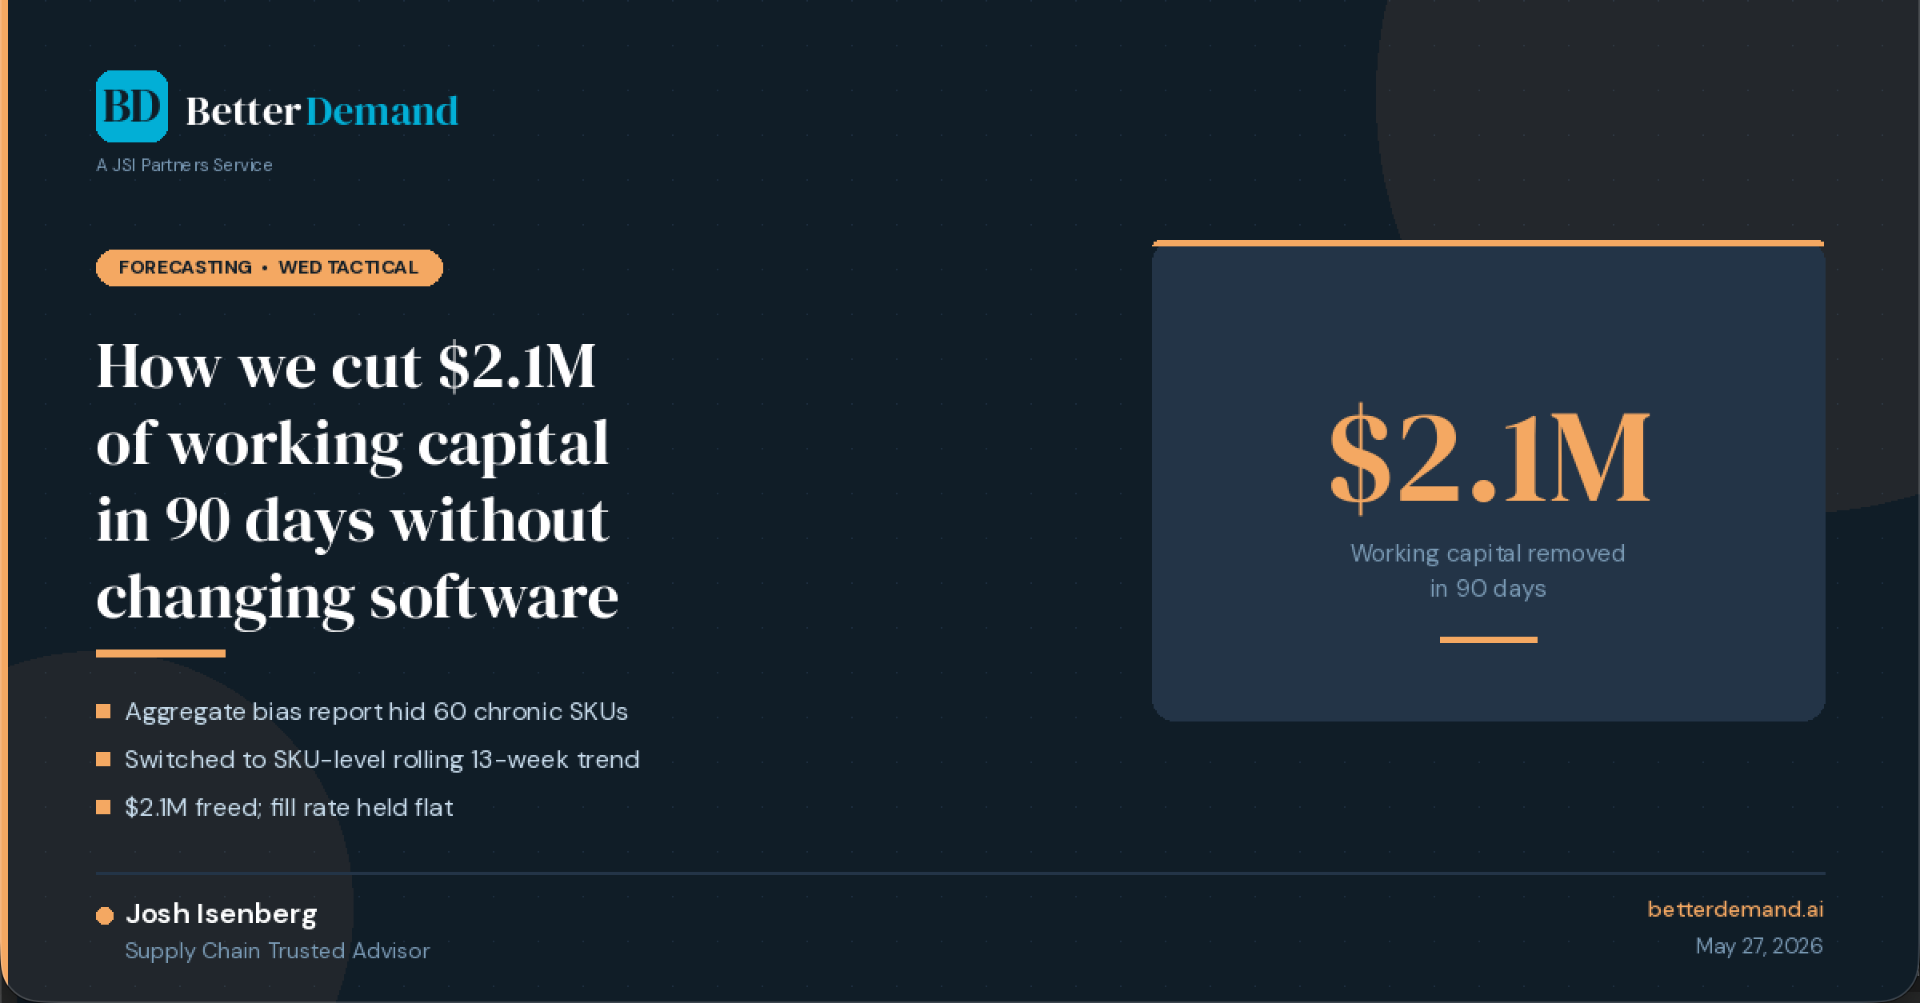
A $90M mid-market food distributor freed up $2.1M of working capital in 90 days. The forecasting software didn't change. The planner didn't change. The way the team measured forecast bias did. That single shift surfaced a problem that had been hiding inside their reports for over a year.
The Aggregate Number Was the Problem
Before the project, the planning team reviewed bias once a month, in aggregate, expressed as a percentage of total forecast. Most months landed inside a plus-or-minus five percent band. The report looked clean. Leadership stopped asking questions about it. The CFO assumed the planning function was healthy because the headline metric was healthy.
It wasn't. About 60 SKUs were running chronic positive bias of around eighteen percent — meaning the forecast consistently called for more than the business actually sold. That overforecast had been steady for fourteen straight months. Every replenishment cycle, the planner ordered too much of those items. Every cycle, the variance washed out at the category level because slower-moving SKUs and faster-moving SKUs offset each other on paper. The dashboard wasn't broken. It was designed to hide exactly this pattern.
The Fix Wasn't Software. It Was Measurement Cadence.
The change took less than a week to implement and cost nothing. Three rules:
First, review bias at the SKU level, not the category or business-unit level. Aggregation is comfortable; it's also where chronic problems disappear.
Second, look at it on a rolling 13-week trend, not a monthly snapshot. A single month is noise. A quarter-long trend is signal.
Third, flag any SKU with three or more consecutive periods of single-direction bias. That rule alone cut through the noise and surfaced exactly the items quietly consuming working capital.
When we ran the new view for the first time, about 60 SKUs lit up immediately. Half were straightforward forecast adjustments the planner could make the same week. The other half were promotional uplifts and seasonality assumptions baked into the model that had not been revisited since 2022. Once those were corrected, the order-up-to targets dropped accordingly, and 90 days later the working capital came out — $2.1M in cash that had been sitting on shelves. Fill rate held flat. Service didn't slip.
What This Means for Mid-Market Operators
If your bias report only shows you an aggregate number, you don't have a bias report. You have a comfort blanket. The number that matters is not whether your overall forecast is within five percent — it's how many of your SKUs are systematically wrong in the same direction, period after period. Those are the items quietly funding your excess inventory line.
Most mid-market planning teams already have the data to build this view. They are reviewing the wrong cut of it. Fix the cut, fix the cadence, and the cash usually shows up faster than anyone expects.
Ready to Forecast Smarter?
BetterDemand combines AI-powered forecasting with real supply chain expertise. Visit betterdemand.ai to learn how we help distributors and manufacturers plan with confidence.